clicking on the star symbol. You can also add and define other tabs by clicking on the plus symbol. You can drag tabs to rearrange their sequence or right click on the tab then select delete to delete.
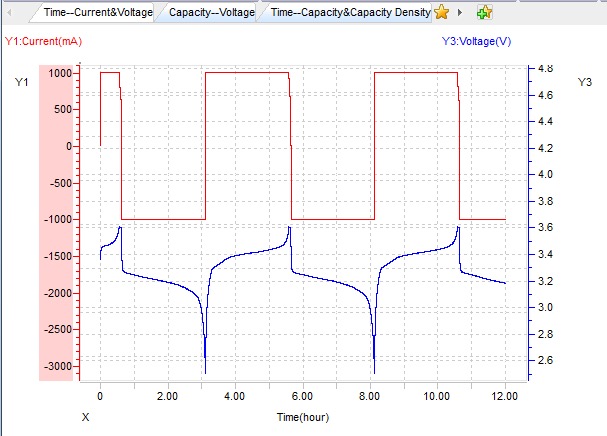
Curve-View
Generally, when you move your mouse on to the axis, the column close to the axis will enable you scroll the axis, the other column will enable you scale the axis.
These tools![]() on the Tool bar will enable you:
on the Tool bar will enable you:
- Hand Tool: Drag the curves to decide which segment into the view.
- Arrow Tool: Double click on the curves, will show you the corresponding original data in data area when the curve has a Time or Cycle ID X-axis.
- Zoom-in: Drag your mouse in the shape of rectangle to zoom in the curves.
- Flex Tool: This is similar as you scroll the mouse wheel. Drag up to zoom in, down to zoom out.
- Reset: Reset the curves to their original states. This function is provided also on the right menu of the curve area.
- Copy: Copy graph to clipboard. This function is provided also on the right menu of the curve area.
- Undo: Undo previous action.
- Redo: Redo previous action.
2) When you right click on the axis, there are below commands provided to adjust the graph. You can set the grid lines by Setting Scale, change data unit by Setting Unit, show or hide the corresponding curves. Unit setting functions on whole data file.
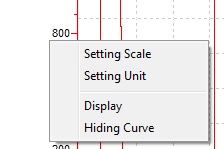
Axis-Setting
3) When you right click on the curve area, there is Curve Settings allowing you set curve parameters. You are allowed to assign maximum 4 Y-axis for a single graph. Y1 and Y2 are on the left. Set curve color or background color by clicking on the color block associated. Unselect the label from the Label List will delete it. Right click on the label will enable you rename the label or delete it.
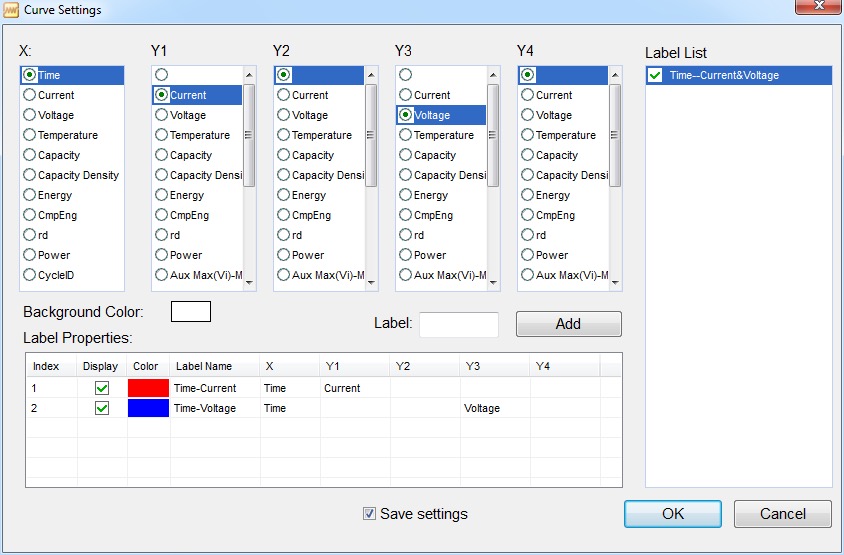
Curve-Setting